See which page readers stop on: page-by-page analytics for PDFs and decks
Lost them on page 4?
page-by-page reading
Knowing that someone opened your deck is the first question. The second one matters more: how far did they get? A 15-page pitch deck that everyone closes after page 4 has a page 4 problem, and no amount of follow-up emails will fix it. A plain view counter can't tell you that. Page-by-page analytics can.
This guide explains what page-level analytics for a PDF actually measures, how to read the chart, what a “biggest drop-off” really means, and how to fix the page that is losing your readers.
What page-by-page analytics measures
When you send a PDF as a link instead of an attachment, the file opens in a viewer in the reader's browser. That viewer knows which page is on screen and for how long. Collected across every reader, it answers three questions per page:
- Reach: what share of readers got at least this far, measured by the furthest page each reader reached. Page 1 is 100% by definition; every later page can only be the same or lower.
- Time on page: the average seconds readers spent on it, counted only while the tab was visible and in focus, so a deck left open in a background tab doesn't inflate anything.
- Share of attention: how much of all reading time this page got. It shows which pages people actually study and which they flip past.
How to read the chart
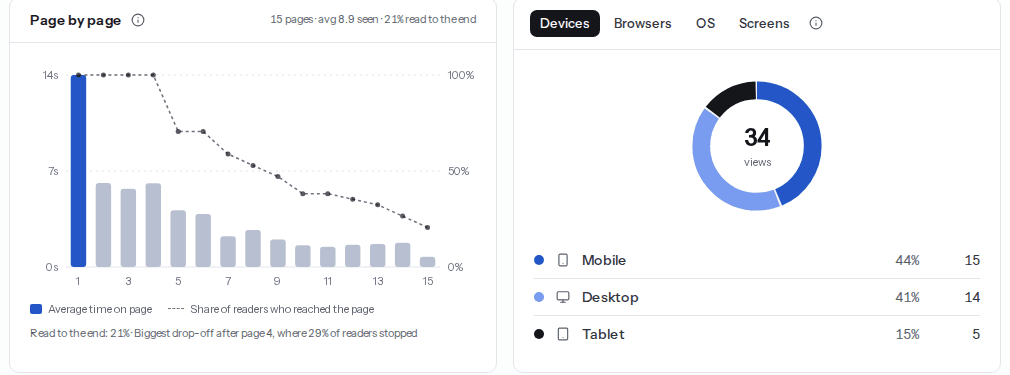
Read the dotted line first. It is your reader funnel. A healthy document loses people gently, a few points per page. A cliff, where the line drops sharply between two pages, marks the moment a chunk of your audience decided they had seen enough.
Then read the bars. A tall bar is a page people slowed down on. That is good on your pricing or traction page and bad on a page that should take five seconds, where it usually means the page is confusing or too dense.
| What you see | What it usually means | What to try |
|---|---|---|
| A cliff right after page 1 or 2 | The opening doesn't promise enough to keep going | Lead with the outcome or the number, not the backstory |
| A tall bar, then a cliff | A dense page wore readers out | Split it, cut it, or move it to an appendix |
| Short bars all the way, low reach | People are skimming for one thing and leaving | Put that one thing earlier |
| A later page holds more time than the ones before it | Readers skimmed to reach it, often pricing or the team | That page is what they came for; move it up |
| High reach, short time on the last pages | They finished, but the ending is weak | End with one clear next step |
The biggest drop-off, named for you
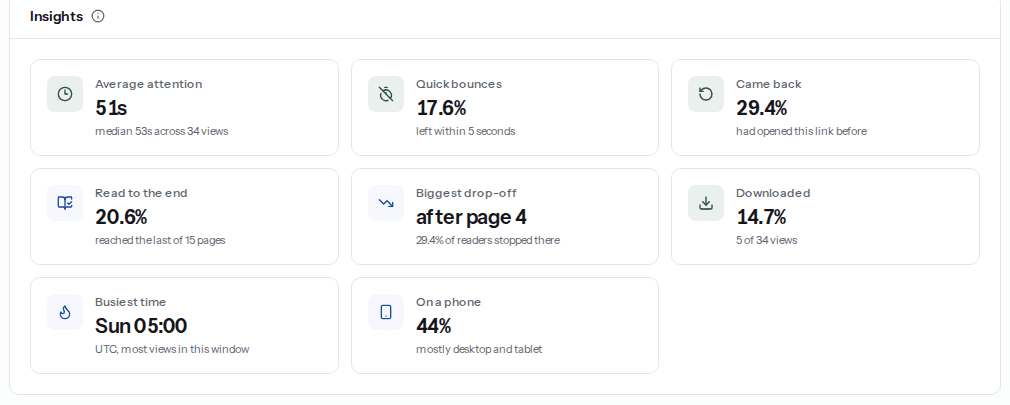
You shouldn't have to eyeball a chart to find the problem. On Link in Seconds the report names the page after which the largest share of readers stopped, for example “after page 4, where 29% of readers stopped”. It sits under the chart and again in the Insights cards.
Two guard rails keep it honest. It only appears once at least three people have read the file, and only when the loss between two pages is at least ten points. One person closing the tab can't invent a “problem page”, and small wobbles that are just noise are not dressed up as a finding.
Fixing the page that loses readers
- Look at the page before the cliff, not after it. “After page 4” means page 4 was the last page they saw. That is the page to change.
- Check its time bar. Long time plus a cliff means it is too heavy. Short time plus a cliff means it gave them a reason to stop: a price shock, an off-topic slide, a wall of legal text.
- Change one thing and replace the file. You don't need to send a new link. Replace the file and the same link, QR code and view history carry on, so the next readers see the new version.
- Compare the next batch. Use the range picker (7, 14, 30 or 90 days) to look at readers since the change. Every number is compared with the period just before it, so you can see whether read-through moved.
Per reader, not just averages
Averages hide people. Open any visit in Recent views and you see that one reader's seconds on each page, their device and where they came from. When the investor you care most about spent two minutes on your financials and skipped the team slide, that is worth knowing before the call.
The Visitors card groups repeat opens from the same network, so you can see who came back for a second read and how far they got each time. If you need actual names, turn on the email gate in Link settings and readers enter an email before the file opens.
Video and web pages get the same treatment
For a video or audio file the report shows watch-through at 25, 50, 75 and 100 percent and names the quarter where most viewers stopped. For web pages, images and text files it shows scroll depth. Same idea: where did attention end?
Where this beats an attachment
A PDF attachment goes quiet the moment you hit send. A link tells you when it was opened, how long it was read, and exactly where interest ran out. If you are sending a deck, a proposal or a report, that last part is the one that changes what you send next time. Start with sending a pitch deck as a link, or see how this compares with DocSend.
Quick answers
Can I see how long someone spent on each page of my PDF?
Yes, if you share the PDF as a link instead of an attachment. The viewer counts the seconds each page is on screen while the tab is visible and in focus. The report shows the average time on every page across all readers, and each visit in Recent views shows that one reader's time per page. Page-level analytics is part of Pro.
What does the biggest drop-off mean?
It is the page after which the largest share of readers stopped reading, for example after page 4, where 29% of readers stopped. It is only named once at least three people have read the file and the loss between two pages is at least ten points, so one reader closing the tab cannot create it.
Does page-by-page tracking work for PowerPoint or Keynote decks?
Export the deck to PDF before you upload it. The page-by-page chart, time per page and drop-off are built for PDFs. Videos get watch-through instead, and web pages, images and text files get scroll depth.
Do readers need an account, and is it private?
Readers never need an account. Tracking is cookieless, IP addresses are turned into a one-way hash before anything is stored, and no names or emails are collected unless you switch on the email gate, which readers see before the file opens.
Turn any file into a link in seconds
Upload a PDF, image, video, or ZIP and get a clean, trackable link with a QR code, free.
Try Link in Seconds →